Statewide :: News & Press :: Interactive Map :: Map Poster :: About the Map :: Landsat Lake Images
| Mapping
Lake Clarity: About the Map |
||
|
What this Map Shows Wisconsin has nearly 15,000 lakes. This map shows the estimated clarity, or transparency, of the 8,000 largest of those lakes as measured by satellite remote sensing. It is the first ever complete map of water clarity for the State of Wisconsin with such detail. Who Made this Map Researchers with the Environmental Remote Sensing Center of the Gaylord Nelson Institute for Environmental Studies at the University of Wisconsin-Madison made this map. Funding was provided by the NASA Affiliated Research Center (ARC) and Regional Earth Science Applications Center (RESAC) programs, and by the North Temperate Lakes Long-Term Ecological Research program (LTER), coordinated by the UW-Madison Center for Limnology. Field data and other assistance were provided by the Wisconsin Department of Natural Resources (WDNR) and the hundreds of citizen volunteers |
of the Wisconsin Self-Help Citizen’s Lake Monitoring
Program.
How to Read this Map The colors of the lakes on the map represent a three-year composite of the estimated clarity of each lake. The base layer is a shaded topographic relief map. Use the legend above to match the color of a lake to the estimated clarity as measured in meters and feet. The clearest lakes are dark blue, and the less clear lakes are light yellow. Please note that not all lakes are represented in this map but only the largest 8,000. Also note that “clarity” refers to the clarity of each lake as it appeared to the satellite on one late summer day in 1999, 2000, or 2001. Here’s why. To generate this full statewide map, researchers needed cloud-free imagery for the whole state. This could only be accomplished by building a mosaic of the clear parts of many images. It took three summers to collect enough clear imagery to complete the “puzzle.” |
|
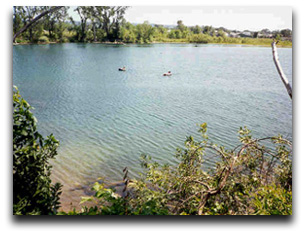
 This Lake is Oligotrophic Lakes like this are generally clear, deep and free of weeds or large algae blooms. Although they are beautiful, they are low in nutrients and do not support large fish populations. However, oligo-trophic lakes often develop a food chain capable of sustaining a very desirable fishery of large game fish. They are also desirable for other recreational activities such as swimming and boating (photos courtesy of Univ. of Minnesota). |
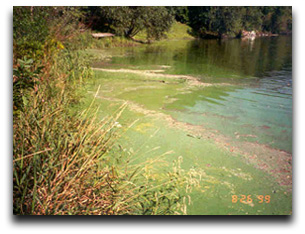
 This Lake is Eutrophic Lakes like this are high in nutrients and support a large biomass (all the plants and animals living in a lake). They are usually either weedy or subject to frequent algae blooms, or both. Eutrophic lakes often support large fish populations, but are also susceptible to oxygen depletion. Small, shallow, eutrophic lakes are especially vulnerable to winterkill which can reduce the number and variety of fish. Rough fish are commonly found in eutrophic lakes. |
|


